Switching Between Tidyverse and Pandas for Tabular Data Wrangling: Tidying Data
Introduction
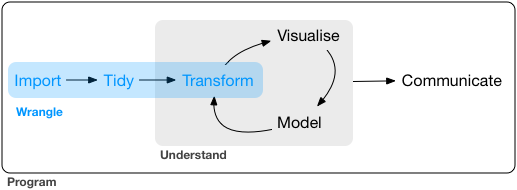
The third post of the “Switching Between Tidyverse and Pandas for Tabular Data Wrangling” series focus on another important aspect of data wrangling: tidying data (see Figure 1 , which is taken from (Wickham and Grolemund 2016)).
As with the other posts in the series, this one does not intend to give a comprehensive introduction to related functions/methods and their usages. Instead, it only focuses on the most essential ones based on my personal experience. Where multiple solutions exist for the same purpose, the ones that minimizes the difference between tidyverse and pandas are chosen. Hopefully, these efforts will make the switch between the two packages easier.
Note: currently, this post only covers data-reshaping operations; more content may be added in the future.
Update: A new pair of functions (i.e., pivot_longer() and pivot_wider()) are now available in the tidyr R package, which are meant to replace some existing functions (i.e., gather() and spread(), which are described in this post). These successors are much more powerful and easier to use; check the vignette for a detailed introduction.
Prerequisites
The code provided in the next few sections requires the following packages:
tidyversefor R;pandasfor Python.
See my other posts (this and this) for instructions on how to install these packages.
Before running the code, make sure that the required packages are properly loaded:
# R
library(tidyverse)
# Python
import pandas as pdReshaping data
In this section, I will use Table 1 , which is taken from (Wickham 2014) with some modifications, as an example for demonstration. The table shows the frequencies of interviewee across different religions and income groups in the US.
| Religion | 0K~20K | 20K~40K | 40K~75K |
|---|---|---|---|
| Agnostic | 61 | 141 | 213 |
| Atheist | 39 | 89 | 105 |
| Buddhist | 48 | 64 | 91 |
| Catholic | 1035 | 1402 | 1754 |
| Others | 2040 | 2660 | 3053 |
According to Wickham (2014), this dataset can not be considered “tidy”. The three columns *K~*K are not names of variables, but values of one variable (Income). As a result, each row stores three observations (Frequency) instead of one.
To tidy this dataset, we need to stack the income columns and the corresponding frequencies into a new pair of variables, i.e., Income and Frequency. In tidyverse jargon, Income is referred to as the key, while Frequency is referred to as the value. For this purpose, tidyverse and pandas respectively offers the gather() function and the melt() method. The following code shows how to perform this kind of reshaping, assuming df_unstacked is the name of the original data frame:
# R
df_stacked <- df_unstacked %>% gather(key = "Income", value = "Frequency",
                     `0K~20K`, `20K~40K`, `40K~75K`)
# Or equivalently:
df_stacked <- df_unstacked %>% gather(key = "Income", value = "Frequency", -Religion)
Note that since 0K~20K, etc. are not syntactic names for columns, we have to surround them in backticks.
# Python
df_stacked = df_unstacked.melt(var_name="Income", value_name = "Frequency",
                               id_vars=["Religion"],
                               value_vars=["0K~20K", "20K~40K", "40K~75K"])
In some cases, you may also want to reverse the operation, i.e., unstack some columns. For this purpose, tidyverse provides the spread() function while pandas provides the pivot() method:
# R
df_unstacked <- df_stacked %>% spread(key = Income, value = Frequency)
# Python
df_unstacked = df_stacked.pivot(index = "Religion", columns = "Income", values = "Frequency")Note that the pivot() method returns a data frame with the variable Religion as an index, not a column. To convert the index to a column, use reset_index(). E.g., df_unstacked = df_stacked.pivot(index = "Religion", columns = "Income", values = "Frequency").reset_index(). Additionally, you may also want to remove the name of the column label (Income); to do this, use df_unstacked.rename_axis("", axis = 1).
Figure 2 provides a visualization of the process of stacking/un-stacking the data set. Note how each component is colored differently: the cells associated with the key (i.e., Income) are green; the cells associated with the value (i.e., Frequency) are orange; the remaining cells (associated with Religion) are blue.
Learning more
If you want to learn more about transforming data using tidyverse or pandas, here are some useful resources:
- R for Data Science by Wickham and Grolemund (2016);
- Python for Data Analysis by McKinney (2018);
- The documentation of tidyr (a module of tidyverse for data tidying) (tidyverse.org n.d.);
- The documentation of pandas (pydata.org n.d.).