Switching Between Tidyverse and Pandas for Tabular Data Wrangling: Merging and Splitting Data
Introduction
This is the fourth post of the “Switching Between Tidyverse and Pandas for Tabular Data Wrangling” series. It covers the following operations:
- Concatenating data frames by rows/columns.
- Joining data frames by keys.
- Splitting a data frame by groups.
As with the other posts in the series, this one does not intend to give a comprehensive introduction to related functions/methods and their usages. Instead, it only focuses on the most essential ones based on my personal experience. Where multiple solutions exist for the same purpose, the ones that minimizes the difference between tidyverse and pandas are chosen. Hopefully, these efforts will make the switch between the two packages easier.
Prerequisites
The code provided in the next few sections requires the following packages:
tidyversefor R;pandasfor Python.
See my other posts (this and this) for instructions on how to install these packages.
Before running the code, make sure that the required packages are properly loaded:
# R
library(tidyverse)
# Python
import pandas as pdConcatenating datasets
Data frames (e.g., the ones shown in Figure 1 ) can be concatenated in one of two ways:
- Data frames that have shared columns (i.e., columns with identical names and data types) can be concatenated along the row axis.
- Data frames that have the same number of rows (typically from the same observations) can be concatenated along the column axis.
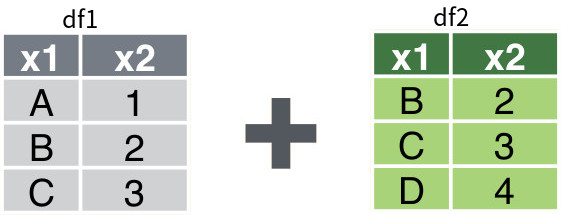
Tidyverse provides two functions for data frame concatenation; i.e., bind_rows() for concatenating along the row axis and bind_cols() for concatenating along the column axis. On the other hand, pandas provides the concat() function to achieve both purposes.
The following code shows how to concatenate df1 and df2 ( Figure 1 ) along the row axis with tidyverse and pandas respectively:
# R
list(df1, df2) %>% bind_rows()
# Python
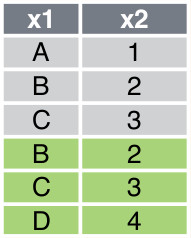
pd.concat([df1, df2], axis = 0)Note that since pd.concat() is more general purpose, it needs an additional parameter axis to determine which axis to concatenate along. The default axis = 0 specifies the row axis, while axis = 1 specifies the column axis.
The resulting data frame is shown in Figure 2 .
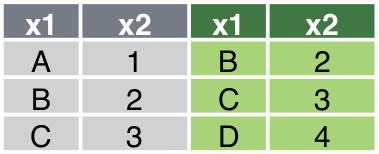
The following code shows how to concatenate df1 and df2 along the column axis with tidyverse and pandas respectively:
# R
list(df1, df2) %>% bind_cols()
# Python
pd.concat([df1, df3], axis = 1)The resulting data frame is shown in @#fig-horizontal-concatenation .
Joining datasets
There are four types of join in SQL1:
1 See (w3schools 2019) for a brief introduction to different types of joins.
- Left (outer) join.
- Right (outer) join.
- Inner join.
- Full (outer) join.
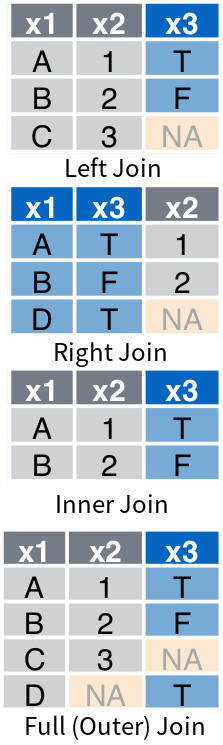
They are supported by tidyverse through four specialized functions: left_join(), right_join(), inner_join() and full_join(). The same functionalities are supported by the pandas merge() method, which has a parameter called how that determines which type of join to use (i.e., "left", "right", "inner", "outer"). Given df3 and df4 shown in Figure 4 :
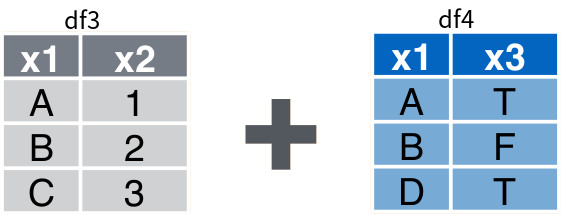
the following code shows how to perform the four types of join between in tidyverse and pandas respectively.
# R
df3 %>% left_join(df4, by = c("x1"))
df3 %>% right_join(df4, by = c("x1"))
df3 %>% inner_join(df4, by = c("x1"))
df3 %>% full_join(df4, by = c("x1"))
# Python
df3.merge(df4, how = "left", on = ["x1"])
df3.merge(df4, how = "right", on = ["x1"])
df3.merge(df4, how = "inner", on = ["x1"])
df3.merge(df4, how = "outer", on = ["x1"])The resulting data frames are shown in Figure 5 .
The above join operations only use one key; to join on multiple keys, append by/on with more column names. Additionally, to join by different names, pass a named vector as the argument to by in *_join(); or use left_on and right_on to specify the keys in pd.merge(). For example, suppose the key columns in df3 are x1 and x2, while the corresponding key columns in df4 are x1 and x3; then the following code shows how to perform a left join:
# R
df3 %>% left_join(df4, by = c("x1" = "x1", "x2" = "x3"))
# Python
df3.merge(df4, how = "left", left_on = ["x1", "x2"], right_on = ["x1", "x3"])Splitting a dataset
In practice, I often find myself splitting a dataset into a list of smaller datasets by groups of observations. The tidyverse provides the group_split() function2 specifically for this purpose. While pandas does not offer a direct equivalent, this task can still be accomplished with a little extra coding.
2 The group_split() function will be shipped with dplyr 0.80. At the time of this writing, it is not yet available from CRAN, but you can install it from Github.
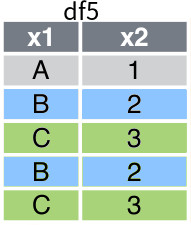
Consider a data frame called df5, which is presented in Figure 6 . Suppose x1 is the variable that is used to group the observations, then the fowllowing code shows how to split the data frame according to this grouping:
# R
df5 %>% group_by(x1) %>% group_split()
# The following shortcut is also possible if the dataset has not been grouped already:
# df5 %>% group_split(x1)
# Python
df5_grouped = df5.groupby(["x1"])
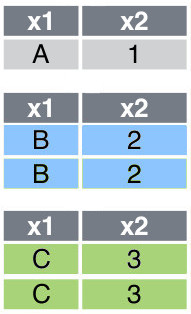
[df5_grouped.get_group(group) for group in df5_grouped.groups]Figure 7 shows the list of splitted data frames.
In case there are more than one grouping variable, simply add them in group_by() (unquoted) or groupby() (quoted). E.g., df5 %>% group_by(x1, x2) or df5.groupby(["x1", "x2"]).
Learning more
If you want to learn more about merging and splitting datasets using tidyverse and pandas, here are some useful resources:
- R for Data Science by Wickham and Grolemund (2016);
- Python for Data Analysis by McKinney (2018);
- The documentation of dplyr (a module of tidyverse for data manipulation) (tidyverse.org 2019);
- The documentation of pandas (pydata.org 2019).