Switching Between Tidyverse and Pandas for Tabular Data Wrangling: Transforming Data
Introduction
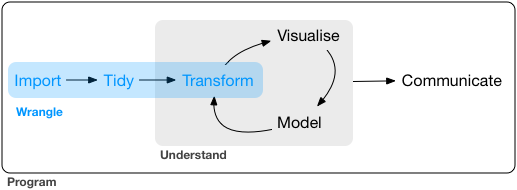
This second post of the “Switching Between Tidyverse and Pandas for Tabular Data Wrangling” series focus on another important aspect of data wrangling: transforming data (see Figure 1 , which is taken from (Wickham and Grolemund 2016)).
As with the other posts in the series, this one does not intend to give a comprehensive introduction to related functions/methods and their usages. Instead, it only focuses on the most essential ones based on my personal experience. Where multiple solutions exist for the same purpose, the ones that minimizes the difference between tidyverse and pandas are chosen. Hopefully, these efforts will make the switch between the two packages easier.
Prerequisites
The code provided in the next few sections requires the following packages:
tidyversefor R;pandasfor Python.
See my other posts (this and this) for instructions on how to install these packages.
Before running the code, make sure that the required packages are properly loaded:
# R
library(tidyverse)
# Python
import pandas as pdI will use the mtcars dataset, which is bundled with R, for demonstration in the following examples1. The dataset can be exported to a CSV file, which can then be loaded to Python (see how). You may run the code yourself to see the results.
1 The examples are only intended to demonstrate the usage of related functions and methods. The results and their meanings are not important.
Picking rows by values
The tidyverse provides the filter() function for picking rows that satisfy some conditions; the pandas equivalent is the query() method. The following code shows how to keep only the rows where not am == 1 and hp / cyl >= 20 are both satisfied:
# R
mtcars %>% filter(!((am == 1) & (hp / cyl >= 20)))
# Python
mtcars.query("~((am == 1) & (hp / cyl >= 20))")In both approach, columns of the data frame can be directly identified in the expression and do not need to be qualified by the name of the data frame. However, note two major differences:
- The expression in
filter()is unquoted, while that inquery()is quoted. filter()uses!as a negation operator, whilequery()uses~.
In some cases, it is necessary to use a variable (e.g., an integer x), which is not one of the columns in the data frame in the expression. The following examples shows how:
# R
mtcars %>% filter(mpg == !!x)
# Python
mtcars.query("mpg == @x")Note the differences in the symbols placed before the variable x.
Picking columns by names
The tidyverse provides the select() function for picking columns by names; the pandas equivalent is the .loc method. The following examples show how to select columns mpg, cyl, disp, hp, drat, wt, qsec from mtcars:
# R
mtcars %>% select(mpg, cyl, disp, hp, drat, wt, qsec)
# Python
mtcars.loc[:, ["mpg", "cyl", "disp", "hp", "drat", "wt", "qsec"]]The same result can also be achieved by dropping the other columns in the dataset. The following code shows how:
# R
mtcars %>% select(-vs, -am, -gear, -carb)
# Python
mtcars.drop(["vs", "am", "gear", "carb"], axis = 1)Related: tidyverse and pandas both provide the rename() function/method for renaming columns. E.g., mtcars %>% rename(cylinder = cyl) (tidyverse way); mtcars.rename(columns = {"cyl": "cylinder"}) (pandas way).
Reordering rows
The tidyverse provides the arrange() function for reordering rows; the pandas equivalent is the sort_values() method. The following code shows how to reorder the rows sequentially by am (in a descending order), hp (in an ascending order) and wt (in an ascending order).
# R
mtcars %>% arrange(desc(am), hp, wt)
# Python
mtcars.sort_values(["am", "hp", "wt"], ascending=[False, True, True])Note that by default, rows are sorted in an ascending order of the target column. arrange() uses the desc() function to reverse the order while sort_values() uses the ascending option.
Creating new columns
The tidyverse provides the mutate() function for creating new columns; the pandas equivalent is the assign() method. The following code shows how to compute a new column named hp_per_cyl, which is hp divided by cyl in tidyverse and pandas.
# R
mtcars %>% mutate(hp_per_cyl = hp / cyl)
# Python
mtcars.assign(hp_per_cyl = mtcars.hp / mtcars.cyl)Note that while it is not necessary to qualify the columns in mutate(), it is necessary to qualify those in assign() using the dataset name mtcars. Similar to a previous example, if you want to use a variable x which is not a column of the dataset, precede it with !!. E.g., mtcars %>% mutate(hp_per_cyl = hp / cyl * !!x).
Performing aggregation
The tidyverse provides the summarise() function2 for aggregation; the pandas equivalent is the agg() method. By default, the aggregation treats all rows as one group. To separate groups for aggregation, use the group_by() function in tidyverse, or the groupby() method in pandas. The following code shows how to group rows by am and cyl, and then compute the mean and maximum value of mpg, as well as the minimum value hp.
2 The alias summarize() can be used interchangeably.
# R
mtcars %>% group_by(am, cyl) %>% summarise(mean(mpg), max(mpg), min(hp))
# Python
mtcars.groupby(["am", "cyl"]).agg({"mpg": [numpy.mean, numpy.max], "hp": [numpy.min]})Performing window aggregation
A window function is a variation on an aggregation function. Where an aggregation function, like sum and mean, takes n inputs and return a single value, a window function returns n values. Typical window functions include cumulated sum, rank, etc.
An aggregation function can also be used like a window function, in which case the returned value is broadcast to the same number of inputs. To perform such kind of aggregation, the tidyverse provides the group_by() + mutate() functions; the pandas equivalent is the groupby() + transform() methods. The following code adds a new column that stores the mean of mpg by each am group for each row:
# R
mtcars %>% group_by(am) %>% mutate(mean_mpg_by_am = mean(mpg))
# Python
mtcars.assign(mean_mpg_by_am = lambda x: x.loc[:,["am", "mpg"]].groupby(["am"]).transform(numpy.mean))Learning more
If you want to learn more about transforming data using tidyverse or pandas, here are some useful resources:
- R for Data Science by Wickham and Grolemund (2016);
- Python for Data Analysis by McKinney (2018);
- The documentation of dplyr (a module of tidyverse for data manipulation) (tidyverse.org n.d.);
- The documentation of pandas (pydata.org n.d.).